XLInterp Puts Spreadsheet Tables to Work
The following is an introductory explanation of our XLInterp product. It provides you with a general understanding of what the product does and why we think you will want it. For more details, check the XLInterp product sheet.
If you’re like me, you probably appreciate the spreadsheet program as the greatest thing to come along since the calculator. I don't want to date myself, but I remember when the standard calculating tool was the slide rule! Well, we've come a long way since then. The latest spreadsheet programs are jam-packed with features and functions that enable you to tackle just about any problem. It’s been said that 80% of people who work with spreadsheets use only 20% of the features. I'm willing to bet that you're in the other 20%, who are constantly pushing the spreadsheet to its limits.
Functions Technical People Need
Over the years, I've spoken with many of you and I am impressed with what you've been able to accomplish with your spreadsheets. Most of you like the spreadsheet because it is so flexible. Sure there are specialty programs available to solve many problems, but they never quite do exactly what you want.
Of course, even with all of their features, spreadsheet programs don't contain any real engineering functions. That's where we come in. Techware has been providing engineering add-in functions for spreadsheets since 1985. Our most popular packages contain accurate functions for thermodynamic properties of fluids including steam, air and combustion gases. This product is a general purpose package called XLInterp that adds powerful interpolation functions to your Excel spreadsheets.
Using Tables of Data as Curves
You're probably already familiar with Excel's built-in HLookup and VLookup functions, which enable you to lookup a value in a table. The VLookup function, for example, will search down the first column in a table looking for the first value which either equals or exceeds your input argument. It then returns a value on that row in the column you specify. This is fine if your table represents discrete items such as unit costs versus quantity, but engineers often use tables to represent continuous functions. We express everything as curves: thermodynamic properties, transport properties, material properties, equipment performance, efficiencies, etc. I can think of hundreds of examples and anything that can be represented by a curve can be put into a table.
Our product, XLInterp, treats the data in these tables as points on a curve or a family of curves, rather than as a collection of items. It does this by a process called interpolation as the name suggests and offers a choice of two types of interpolation, linear and non-linear. Both methods start the process in a manner similar to the Lookup functions. They search down the first column of the table looking for two values that bracket the input argument. But here's where the similarity ends. Instead of returning one of the values from the table, the function plots a curve through the points in the table and returns a value on that curve. The linear method uses the two bracketing points, which it found during the search and constructs a straight line through those points. The non-linear method grabs two additional adjoining points and constructs a third order polynomial curve through the four points. Using the expression for the curve, the function calculates a value on the curve at the point designated by your input argument.
I'll bet you're beginning to realize that this is just what you've been looking for, but there's a lot more. I know that some of you are clever enough to perform linear interpolation on a data table using combinations of Lookup and Index functions, but it's not easy. You have to arrange the table in ascending order; index the table; and use the lookup function to find the index value. Then you write a complicated equation using a bunch of Index functions to get to your answer.
I also know that some of you use curve-fitting programs to generate equations for your data, but that method has its own problems. You have to find the type of curve that best represents your data and use some method to generate the coefficients. Then, you have to construct the equations on your spreadsheet. Invariably, you find that the curve doesn't exactly match the data at the points you started with and the curve fits better in some areas than in others. If you ever need to extend the table or change a single data point, you have to start this process all over again. With XLInterp you have none of those problems.
What Does It Do?
Let's look at an example. The table on the Excel spreadsheet below represents the enthalpies of steam as a function of pressure and temperature.
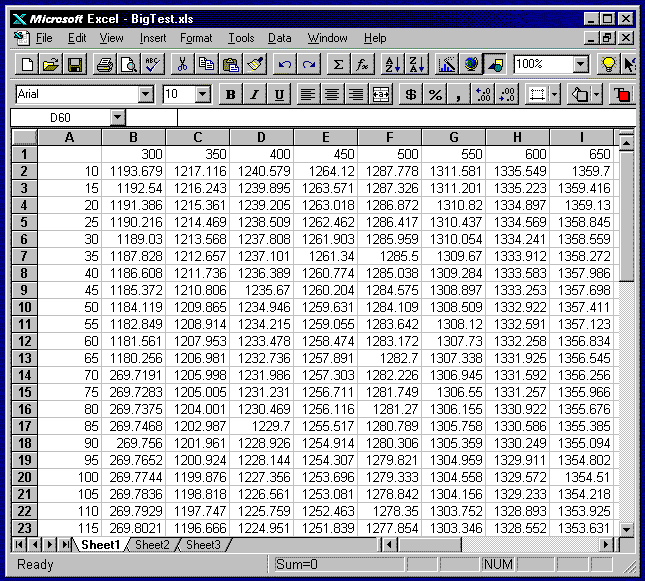
The numbers in column-A are pressures in psia, while the numbers in row-1 are temperatures in degrees F. The rest of the numbers in the table are enthalpy values at the corresponding pressure and temperatures. Suppose you need to find the enthalpies at various pressures and temperatures throughout your spreadsheet. I'm sure you'll recognize this as a two-dimensional problem. Does anyone dare to try to extend either of the methods described above to two dimensions? Even if it can be done, it won't be very practical to use. At best you will end up with a messy linear interpolation scheme or else a loose-fitting surface equation. With XLInterp, the solution is simple using one of its functions, InterpRCT. Simply pass the function the name or coordinates of the table containing the data, a value for pressure, a value for temperature and a flag indicating whether you want to use linear or non-linear interpolation. That's it! The function will return the enthalpy of the fluid at the pressure and temperature you require.
How Does It Work?
Not only is this incredibly simple to do, but the results are extremely accurate. In most cases you will want to use the non-linear method because it gives the best results for smooth curves. What makes this method so accurate is the fact that it only tries to fit a curve to a small segment of the data at a time. Using a third order polynomial fit with four data points insures that the curve will pass through each point. You will find that for most cases, even a coarse spacing of data points will give good results. If you want more accuracy, just add a few more data points to the table. Insert a few rows or columns in the table wherever you need them, fill in the data and you're done. All of the XLInterp functions throughout your worksheet that use this table will update themselves automatically using the new data, whenever the sheet is recalculated. This is a much better approach than conventional curve fitting techniques, which add higher order terms to get better accuracy. These higher order terms often cause the curve to wiggle and still do not insure an exact fit at your data points.
Forward and Backwards
Even if you're still not impressed, this next feature will knock your socks off. Let's continue with the example we started before. Say you have steam at a known pressure and temperature and you have determined its enthalpy. The steam passes through a heat exchanger where it picks up some heat and emerges at a different pressure with a new, calculated, enthalpy. You need to find its temperature. This is a simple request but you can't do it with the existing table using the built-in Excel functions no matter how clever you are and your curve fitting equations won't work either. With XLInterp, the solution is, once again, quite simple. You can use the function InterpRTC and pass it the same table name as before, a value for the new pressure, a value for the new enthalpy and the linear/non-linear flag. The function will return with the new temperature of the fluid. It's that simple, even though there’s quite a bit going on behind the scenes. The InterpRTC and the corresponding InterpCTR functions perform inverse linear or non-linear interpolation using powerful iteration schemes but all that is transparent to the user.
Really Heavy Duty
I'm sure you're impressed by now, but this next feature will really surprise
you. What if you wanted to find the specific heat of the steam. Your first
reaction might be to construct another table of specific heats versus pressure
and temperature and then use the XLInterp functions, just as we
did for enthalpy. That would work but there is an easier solution. If we recall
from thermodynamics, specific heat at constant pressure is equal to
 ,
the partial derivative of enthalpy with respect to temperature at constant
pressure. In theory, we should be able to calculate the specific heat from the
data in the enthalpy table. In fact, XLInterp provides functions
that do this for you. The function, InterpRCdTdC will do the job. Just
provide it with the name of the table, the pressure, the temperature and the
linear/non-linear flag, just as we did with the InterpRCT function. The InterpRCdTdC
function will return the partial derivative of the data in the table (enthalpy)
with respect to the column values (temperature) at constant row value
(pressure), which is the specific heat.
,
the partial derivative of enthalpy with respect to temperature at constant
pressure. In theory, we should be able to calculate the specific heat from the
data in the enthalpy table. In fact, XLInterp provides functions
that do this for you. The function, InterpRCdTdC will do the job. Just
provide it with the name of the table, the pressure, the temperature and the
linear/non-linear flag, just as we did with the InterpRCT function. The InterpRCdTdC
function will return the partial derivative of the data in the table (enthalpy)
with respect to the column values (temperature) at constant row value
(pressure), which is the specific heat.
XLInterp contains a number of partial derivative functions including several that work with inverse interpolation. In effect, you can provide the function with any two out of three variables and return the partial derivative of the data in the table in any direction.
Of course, the best way to calculate steam properties is to use Techware's WinSteam software but XLInterp is a tool you can use on other fluids, not to mention the hundreds of other types of data tables.